Every research leader eventually faces the same question: how many coordinators does our portfolio actually need? Most sites answer it with a rule of thumb, a gut feeling, or whatever last year's budget allowed. This guide shows a better way, using what research sites have already learned by building a real clinical trial staffing model.
TRIALNAV | Research Operations Guide
Why "trials per coordinator" is the wrong question
The most common staffing shortcut is a simple ratio: a fixed number of trials per clinical research coordinator (CRC). It's easy to calculate and easy to explain. It's also misleading, because it treats every trial as the same amount of work.
They aren't. As Adam Torres, Senior Director of Research at Highlands Oncology, put it in his account of getting 11 positions approved: a Phase I first-in-human study and a simple biomarker collection study do not consume the same coordinator capacity. Any staffing model that treats them as equivalent is already wrong before it starts.
The result of count-based staffing is familiar: coordinators carry workloads nobody can fully see, assignments are debated instead of decided, and staffing requests come down to trust rather than evidence. Or, as the Fox Chase Cancer Center work describes it, replacing "this feels like a lot" with an actual number leadership can act on.
The five building blocks of a staffing model
A defensible staffing model doesn't need a perfect dataset. It needs a few building blocks, each answering a question a simple ratio can't.
1. Score protocol complexity
Start by measuring how demanding each protocol really is. A complexity score turns the characteristics of a trial into a comparable number, so a high-acuity oncology study and a low-touch observational study are no longer counted the same.
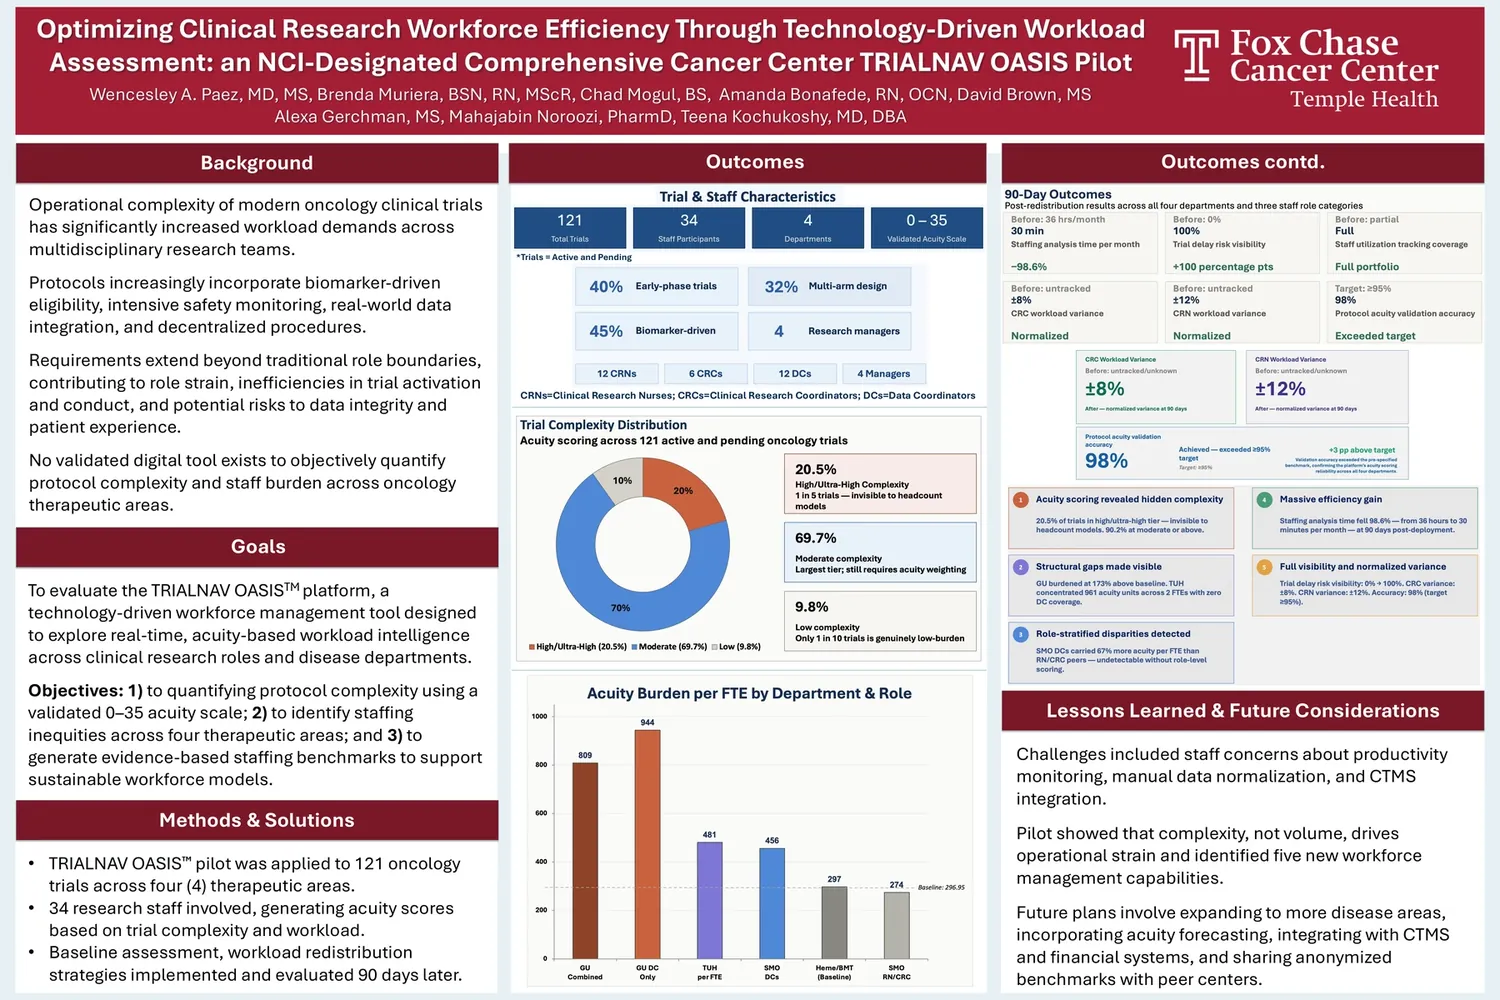
At Fox Chase Cancer Center, TRIALNAV's staffing acuity methodology was applied across the actively enrolling oncology portfolio, turning trial complexity, workload distribution, and resource utilization into a single, comparable score instead of a collection of spreadsheets and gut checks. The work was presented at the AACI Cancer Research Institute meeting, where the methodology itself was reviewed in an academic setting.
2. Account for where patients are in each trial
Workload depends not only on how many trials you run, but on where patients are within them. Tracking active versus follow-up patient status per trial gives a far more accurate picture of the effort each study requires right now.
3. Map the work to the people doing it
Complexity only becomes a staffing decision when it's connected to real people. That means assigning primary and secondary staff by role, competency, and availability, and looking at workload separately for each division, department, or affiliate site instead of one blended average.
4. Forecast forward, not backward
Staffing requests based on current workload arrive too late: by the time the request is made, the workload is already too heavy. The stronger approach is to forecast the year ahead.
At Highlands Oncology, the forecast combined three inputs:
- Current consents per trial
- Three years of historical study starts
- The current breakdown of study types by percentage
Applying the portfolio mix to the projected study count produced a complexity-weighted forecast by trial category, instead of a single headcount number.
5. Translate capacity into financial language
Telling leadership the team is overwhelmed is not a financial argument. Highlands built a revenue baseline by dividing gross research revenue by the number of full-time CRCs, turning an abstract workforce question into a concrete one: what does each coordinator produce, and what does it cost when there aren't enough of them?
What it looks like in practice
Highlands Oncology: 11 positions approved
With the baseline and forecast in hand, Highlands entered the projected study counts and average consents per trial into TRIALNAV OASIS™ and ran the model twice: once with a conservative enrollment assumption and once with an optimistic one. That produced a low and a high estimate for both projected revenue and required FTEs.
Two results stood out. The spread between the manual and OASIS™ revenue estimates was roughly $100,000, a sign the projections weren't inflated. And the FTE count the platform predicted matched almost exactly what had been calculated independently with the manual method. The manual analysis had taken years to build; TRIALNAV OASIS™ ran the equivalent in under an hour.
The request that went to the budget meeting was backed by a revenue-per-CRC baseline, a three-year growth trend, a complexity-weighted forecast, low and high FTE projections, and independent validation of the platform's output. The request was for 11 positions in total. It was approved. Read the full case study.
Highlands Oncology: from guesswork to governance
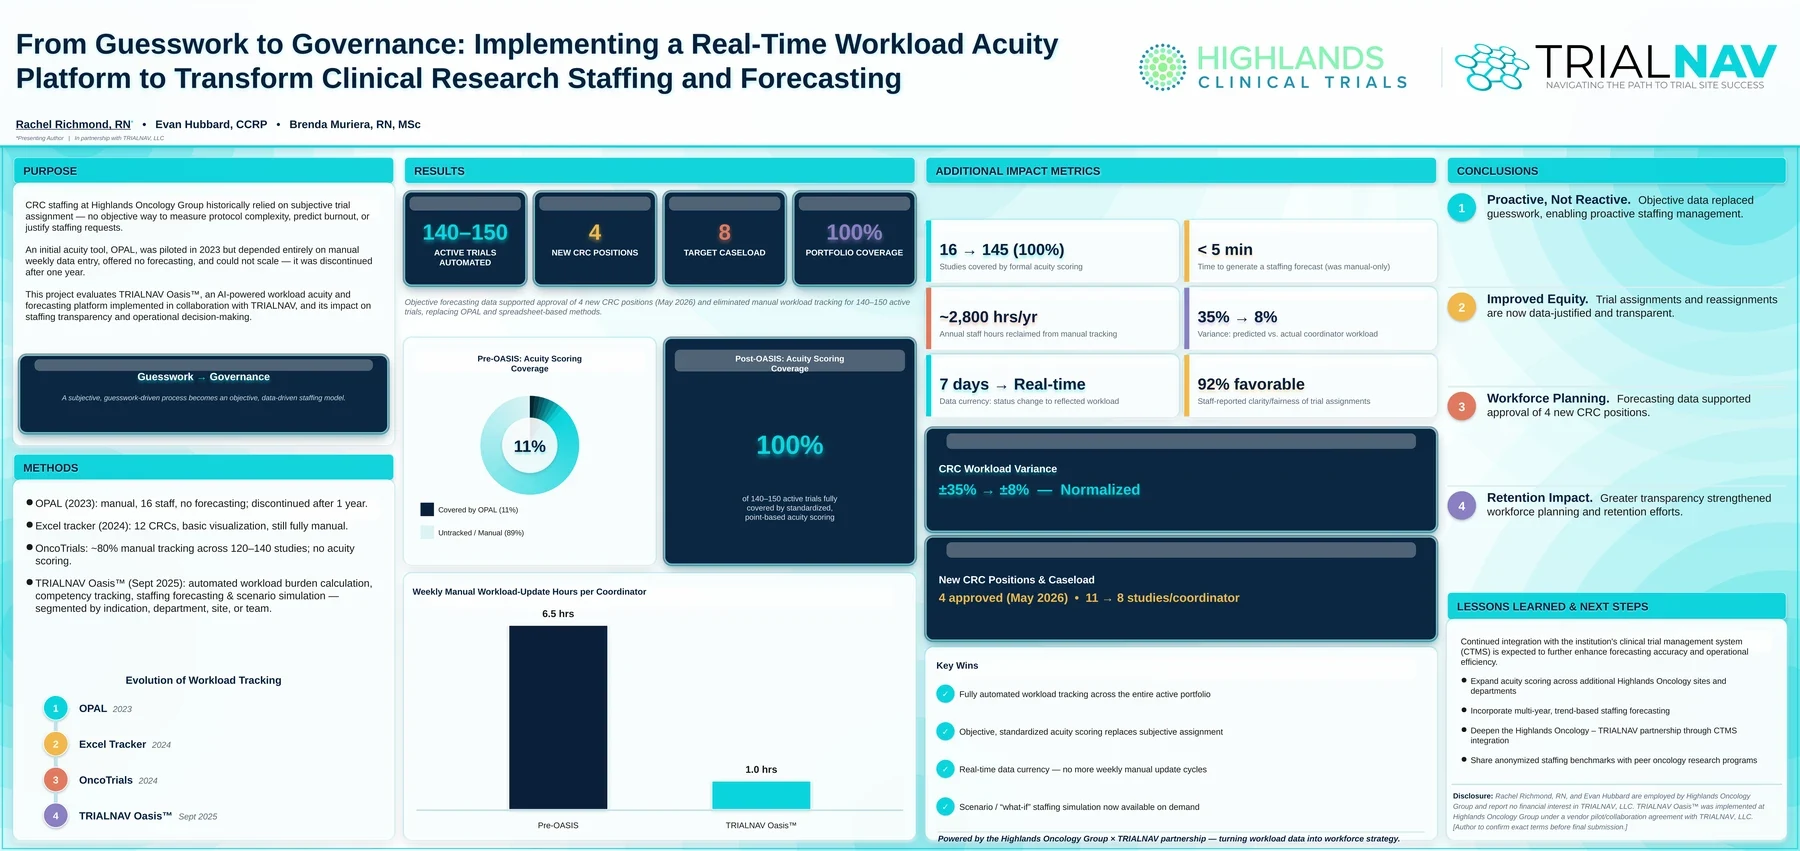
A second Highlands project, presented as a poster at SOCRA 2026, describes the journey to get there. Before TRIALNAV OASIS™, the team worked through three generations of tools: OPAL, an acuity tool that relied on manual weekly updates and was discontinued after one year; an Excel-based tracker; and OncoTrials, which still required roughly 80% manual workload tracking across 120 to 140 studies.
After TRIALNAV OASIS™ was deployed in September 2025:
- Manual workload tracking was eliminated for 140 to 150 active trials as of January 2026
- Four new CRC positions were approved in May 2026, supported by objective forecasting data from the platform
- The program advanced toward its target caseload of eight studies per coordinator
- Staffing discussions became more transparent, with objective justification for trial assignments and reassignments
Note that a target caseload like eight studies per coordinator is specific to a program's own portfolio. It's the outcome of a complexity-weighted model, not a universal rule to copy.
A practical checklist
If you're building your own clinical trial staffing model, start here:
- Inventory your active portfolio, including each trial's phase, type, and patient status
- Score every protocol for complexity with consistent, validated criteria
- Map workload to named staff by role and competency, and per site or department
- Build a forecast from consents per trial, historical study starts, and your study-type mix
- Establish a financial baseline, such as revenue per coordinator
- Model low and high scenarios so leadership sees a defensible range, not a single guess
- Validate the output against your own manual analysis or experience
Where TRIALNAV OASIS™ fits
TRIALNAV OASIS™ brings these building blocks together in one platform. It automatically scores trial complexity, forecasts staffing needs, tracks workload, and models financial outcomes like ROI and break-even, in one connected dashboard instead of scattered spreadsheets.
It works alongside your existing CTMS and EHR rather than replacing them, processes operational data only (no patient-level PHI), and most sites are live within two weeks. The staffing acuity methodology has been validated across both oncology and non-oncology research portfolios, at academic and community sites.
The data to answer "how many coordinators do we need?" usually already exists. The challenge is turning it into evidence leadership can act on.